AUD/USD0.7030 +0.05%
AUD/EUR0.6165 -0.27%
AUD/GBP0.5305 -0.20%
AUD/JPY110.79 -0.75%
AUD/USD0.7030 +0.05%
AUD/EUR0.6165 -0.27%
AUD/GBP0.5305 -0.20%
AUD/JPY110.79 -0.75%
Chhay / Markets

Global markets, major moves and the things I'm watching.

MIXED SOURCESLast updated: 3:46 am AEST

Market Feed

Short notes written as things happen — observations, not recommendations.

08 Sept 2026 · 5:10 pmAnalysis

Gold: Upside Potential Above 4365

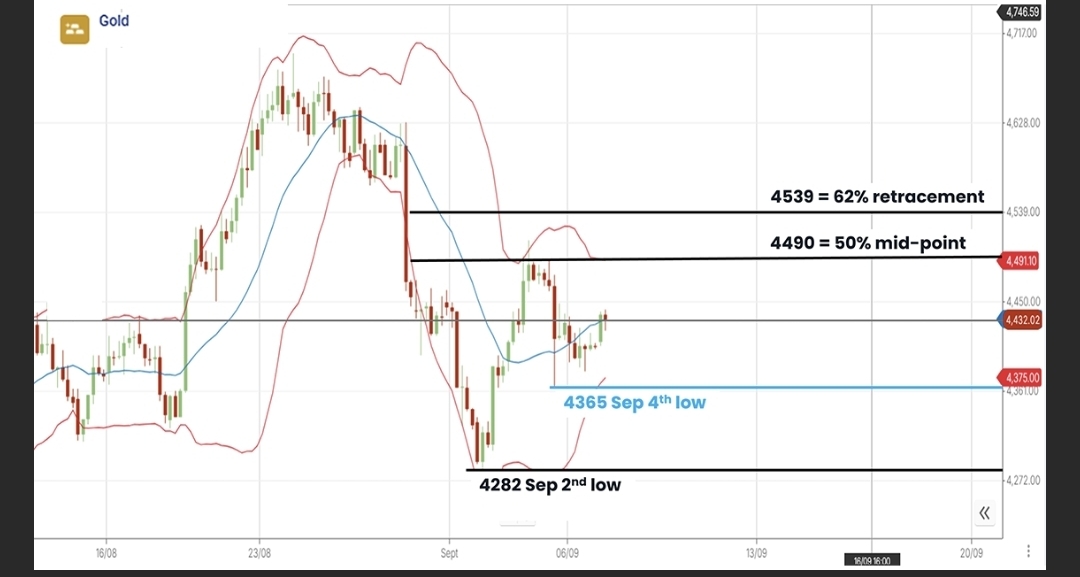
Gold holds above key support at 4365 (September 4th low). While this level holds, risks are for retests of 4490 (50% mid-point); a break above opens 4539 (62% retracement). 4-hourly closes below 4365 expose 4282 (September 2nd low).

Read full analysis →
Watching: XAU/USD
08 Sept 2026 · 5:10 pmAnalysis

Gold Intraday: Key Support Focus 4365

KEY LEVEL: 4365 — September 4th low (4-hour chart)

OUTLOOK: Upside potential — while prices remain above 4365.

## Upside Scenario

While the support level at 4365 (September 4th low) continues to hold, the risks are for retests of resistance at 4490 (50% mid-point). Breaks above 4490 could lead to further price strength toward 4539 (62% retracement).

- 4490 — 50% mid-point

- 4539 — 62% retracement

## Downside Scenario

4-hourly closes below 4365 could lead to further price declines toward the next support at 4282 (September 2nd low).

- 4365 — September 4th low

- 4282 — September 2nd low

Gold Intraday: Key Support Focus 4365Read full analysis →
Watching: XAU/USD
03 Sept 2026 · 8:25 pmWatching

Nasdaq 100 Technical Analysis: Key Levels, Support & Resistance

Nasdaq 100 technical analysis on the 4-hour chart, with the key levels I am watching for both the downside and upside scenarios.

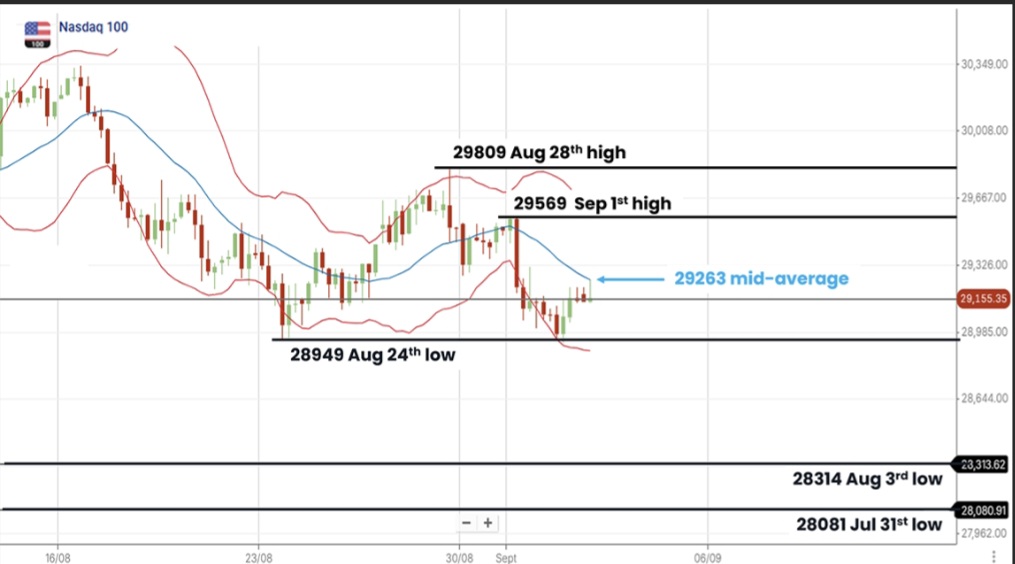
KEY LEVEL: 29,263 — Bollinger mid-average, 4-hour chart

OUTLOOK: Bearish / downside bias — The Nasdaq 100 remains vulnerable to further downside while 4-hourly closes are below 29,263.

## Downside Scenario

While 4-hourly closes remain below resistance at 29,263, which represents the Bollinger mid-average, the downside risk remains active. A break and close below 28,949, the August 24 low, could open the way for further declines.

- 28,949 — August 24 low, first downside support

- 28,314 — August 3 low, second downside target

- 28,081 — July 31 low, third downside target

## Upside Scenario

A sustained break above 29,263 could shift the short-term outlook higher and open the potential for a test of the recent highs.

- 29,569 — September 1 high, first upside resistance

- 29,809 — August 28 high, second upside resistance

Nasdaq 100 Technical Analysis: Key Levels, Support & ResistanceRead full analysis →
Watching: Nasdaq 100
03 Sept 2026 · 8:25 pmWatching

Nasdaq 100: Downside Bias Below 29,263

The Nasdaq 100 remains under downside pressure while 4-hourly closes stay below 29,263. A break below 28,949 could expose 28,314 and 28,081, while a break above 29,263 could target 29,569 and 29,809.

Read full analysis →
Watching: Nasdaq 100
01 Sept 2026 · 10:00 amWatching

Gold Intraday: Key Resistance Focus 4485

Gold Intraday: Key Resistance Focus 4485

Tuesday 01 September 2026

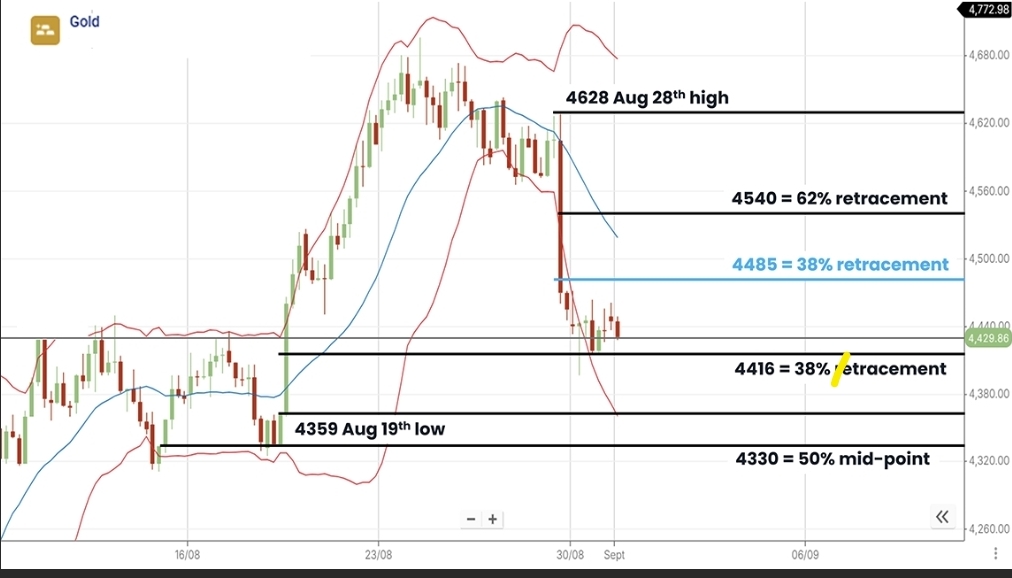
Important level to watch - 4485 (4-hour chart) 38% Fibonacci Retracement

Potential Downside Bias: While 4-hourly closes in price are seen below resistance at 4485 (38% retracement) the risks are for retests of support at 4416 (38% retracement). Breaks below 4416 could open further declines to test 4359 (August 19th low), then 4330 (50% mid-point).

Potential Upside Bias: 4-hourly closes above 4485 could lead to further strength toward the next resistance at 4540 (62% retracement), then 4628 (August 28th high).

Current Outlook: Downside potential while prices remain below 4485.

Gold Intraday: Key Resistance Focus 4485Read full analysis →
01 Sept 2026 · 10:00 amWatching

Nasdaq 100 Intraday: Key Support Focus 29273

Nasdaq 100 Intraday: Key Support Focus 29273

Tuesday 01 September 2026

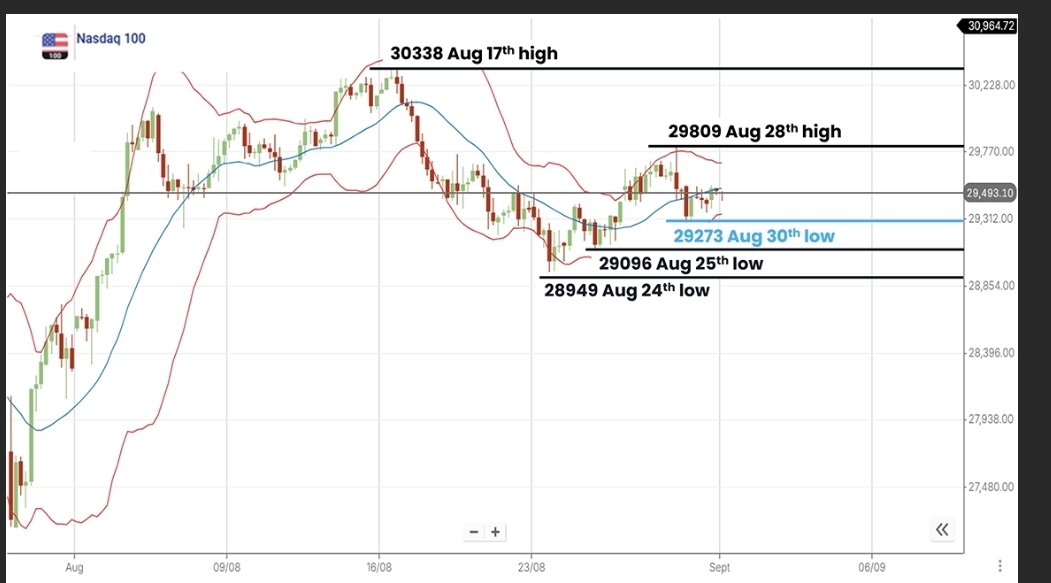
Important level to watch - 29273 (4-hour chart) August 30th Low Trade

Potential Upside Bias: While 4-hourly closes in price are seen above support at 29273 (38% retracement) the risks are for retests of resistance at 29809 (August 28th high). Breaks above 29809 could lead to further price strength toward 30338 (August 17th high).

Potential Downside Bias: Breaks below 29273 could open potential to test the next support at 29096 (August 25th low), then 28949 (August 24th low).

Current Outlook: Upside potential while 4-hourly closes are seen above 29273.

Nasdaq 100 Intraday: Key Support Focus 29273Read full analysis →
26 Aug 2026 · 3:08 pmWatching

Depth analysis and weekly trends as 26 August 2026

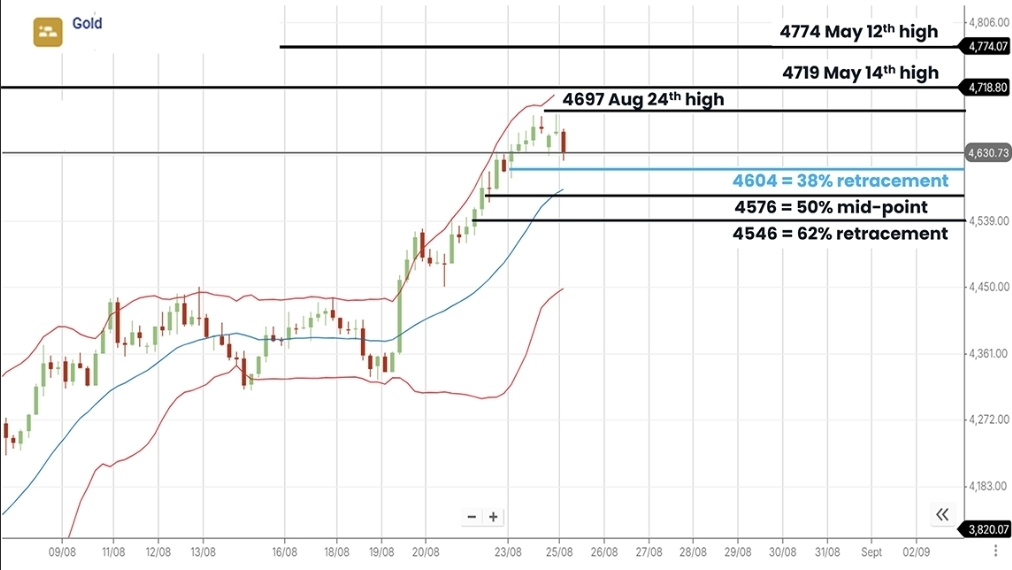
Important level to watch - 4604 (4-hour chart) 38% Fibonacci Retracement

Potential Upside Bias: While 4-hourly closes in price are seen above support at 4604 (38% retracement), the risks are for further upside to retest resistance at 4697 (August 24th high). Closing breaks above 4697 could lead to moves toward 4719 (May 14th high), even 4774 (May 12th high).

Potential Downside Bias: 4-hourly closes below 4604 could open potential for further declines to test the next support at 4576 (50% mid-point), then 4546 (62% retracement).

Current Outlook: Upside potential while prices remain above 4604.

Depth analysis and weekly trends as 26 August 2026Read full analysis →
20 Aug 2026 · 6:31 pmWatching

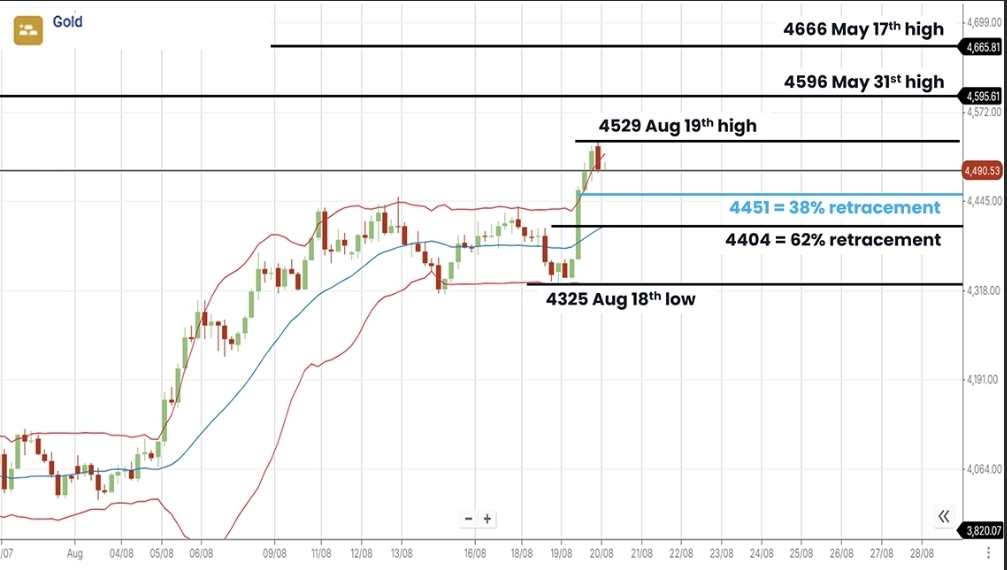
Gold Intraday: Key Resistance Focus 4451

Important level to watch - 4451 (4-hour chart) 38% Fibonacci Retracement

Potential Upside Bias: While 4-hourly closes in price are seen above support at 4451 (38% retracement), the risks are for further upside to test resistance at 4529 (August 19th high). Breaks above 4529 could lead to moves toward 4596 (May 31st high), even 4666 (May 17th high).

Potential Downside Bias: 4-hourly closes below 4451 could open potential for further declines to test the next support at 4404 (62% retracement), then 4325 (August 18th low).

Current Outlook: Upside potential while prices remain above 4451.

Gold Intraday: Key Resistance Focus 4451Read full analysis →
19 Aug 2026 · 8:54 pmAnalysis

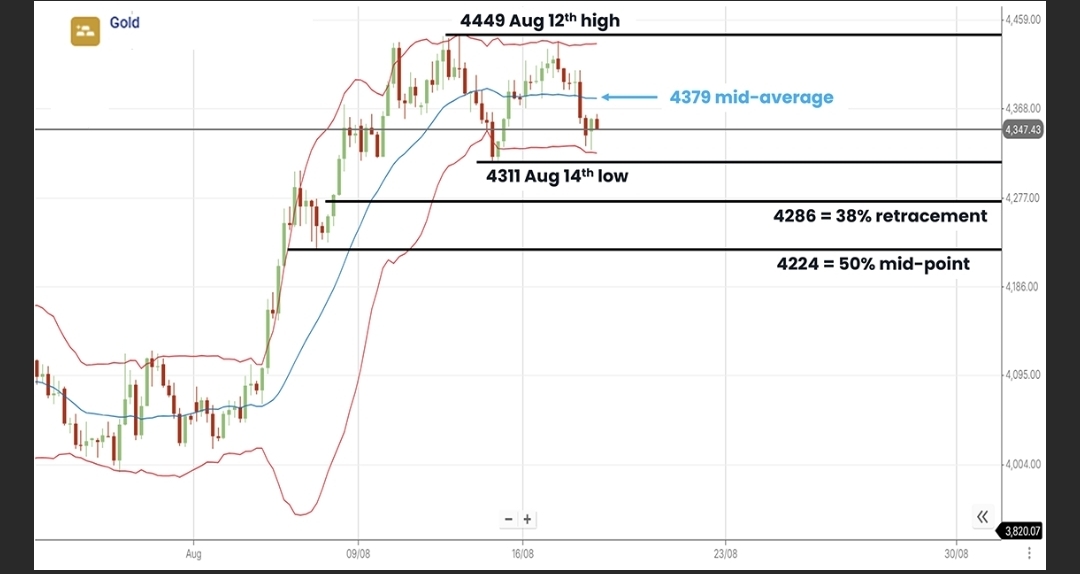
Gold — important level to watch: 4379 (4-hour Bollinger mid-average)

Gold important level to watch — 4379 (4-hour chart) Bollinger mid-average.

Potential downside bias: While 4-hourly closes in price are seen below resistance at 4379 (mid-average), the risks are for further price weakness to test support at 4311 (August 14th low). Breaks below 4311 could expose moves to 4286 (38% retracement), then 4224 (50% mid-point).

Potential upside bias: 4-hourly closes above 4379 could lead to further price strength to test the next resistance at 4449 (August 12th high).

Current outlook: Downside potential while prices remain below 4379.

Gold — important level to watch: 4379 (4-hour Bollinger mid-average)Read full analysis →
Watching: Gold
11 Aug 2026 · 8:33 pmWatching

What I'm watching this week

Gold

US CPI

AUD/USD

Federal Reserve

Watching: Gold · AUD/USD
11 Aug 2026 · 12:00 amTechnical Watch

Gold Intraday — Key Support at 4,355

TECHNICAL WATCH · GOLD · 4-HOUR · 11 AUGUST 2026

BIAS: Upside potential while Gold remains above 4,355

Gold remains constructive while holding above 4,355, a key support level around the 38% Fibonacci retracement on the 4-hour chart.

The main level I'm watching is 4,355. While Gold remains above this level, the focus remains on another test of 4,435 resistance.

LEVELS I'M WATCHING

4,435 — KEY RESISTANCE. 4,435 marks the 11 August high and is the immediate resistance level. A confirmed 4-hour close above 4,435 could open the way toward 4,529, followed by 4,594.

4,355 — KEY SUPPORT. This is the most important level in the current setup and represents the 38% Fibonacci retracement on the 4-hour chart. As long as Gold continues to hold above 4,355 on a 4-hour closing basis, the short-term outlook remains tilted to the upside.

4,305 — NEXT SUPPORT. A confirmed 4-hour close below 4,355 would weaken the current bullish setup and shift attention toward 4,305, the next Fibonacci support area.

4,223 — MAJOR DOWNSIDE SUPPORT. If Gold continues lower through 4,305, the next major level I'm watching is 4,223, around the 6 August low.

UPSIDE SCENARIO

Hold above 4,355 → retest 4,435. A 4-hour close above 4,435 → 4,529. Further strength → 4,594.

DOWNSIDE SCENARIO

A 4-hour close below 4,355 → watch 4,305. A break below 4,305 → watch 4,223.

CURRENT OUTLOOK: BULLISH ABOVE 4,355

The short-term upside bias remains intact while Gold holds above 4,355. A break above 4,435 would strengthen the bullish setup, while a confirmed 4-hour close below 4,355 would weaken it.

VOLATILITY DRIVER: U.S.–Iran developments

Updates surrounding the U.S.–Iran situation remain an important potential volatility driver for Gold, particularly through changes in geopolitical risk and safe-haven demand.

Personal market notes and observations only — not financial advice.
Read full analysis →
Watching: XAU/USD
10 Aug 2026 · 10:33 pmWatching

Watching Gold

Gold is holding above an important level tonight while US equities remain relatively calm.

I'm watching whether the move continues once New York trading picks up.

Watching: Gold · USD · S&P 500
09 Aug 2026 · 10:33 pmUpdate

A quiet session in Sydney

The ASX finished the day close to flat with very little conviction either way. Volumes were light.

Days like this are usually about positioning ahead of offshore data rather than anything local.

Watching: ASX 200
08 Aug 2026 · 10:33 pmThought

A reminder to myself: a single day's move is data, not a trend. Most of what looks like a signal is noise with good timing.

07 Aug 2026 · 10:33 pmMacro

US CPI lands this week

Consensus is for a modest print. The interesting question is not the number itself but how much of it is already in the curve.

Watching: S&P 500 · USD/JPY

Market information and commentary on this website are provided for general information only and do not constitute financial advice. Data may be delayed or sourced from third-party providers, and index and metal prices are delayed or end-of-day. Instruments a provider cannot supply are shown as unavailable rather than estimated.

Crypto prices by CoinGecko · FX reference rates: Frankfurter / source central banks