Nasdaq 100 Technical Analysis: Key Levels, Support & Resistance
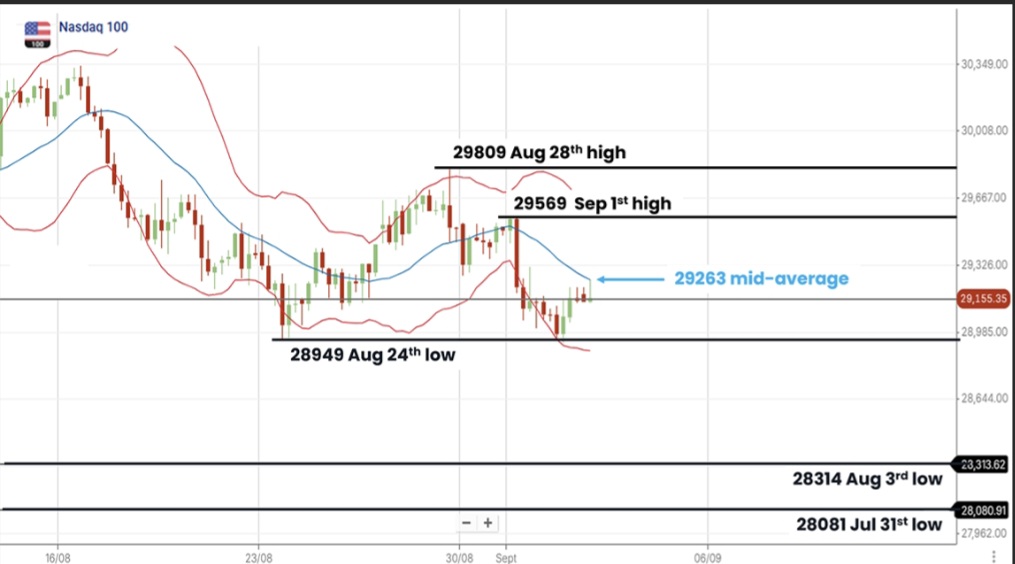
Nasdaq 100 technical analysis on the 4-hour chart, with the key levels I am watching for both the downside and upside scenarios.
Key level to watch
29,263
Bollinger mid-average, 4-hour chart
Current outlook
Bearish / downside bias
The Nasdaq 100 remains vulnerable to further downside while 4-hourly closes are below 29,263.
Downside Scenario
While 4-hourly closes remain below resistance at 29,263, which represents the Bollinger mid-average, the downside risk remains active. A break and close below 28,949, the August 24 low, could open the way for further declines.
- 28,949August 24 low, first downside support
- 28,314August 3 low, second downside target
- 28,081July 31 low, third downside target
Upside Scenario
A sustained break above 29,263 could shift the short-term outlook higher and open the potential for a test of the recent highs.
- 29,569September 1 high, first upside resistance
- 29,809August 28 high, second upside resistance
This analysis reflects my personal observations and is provided for educational and informational purposes only. It is market analysis, not financial advice or a trading recommendation.
Related analysis
- Gold Intraday: Key Resistance Focus 448501 Sept 2026 · 10:00 am
- Nasdaq 100 Intraday: Key Support Focus 2927301 Sept 2026 · 10:00 am
- Depth analysis and weekly trends as 26 August 202626 Aug 2026 · 3:08 pm
- Gold Intraday: Key Resistance Focus 445120 Aug 2026 · 6:31 pm
Weekly Instrument Analysis
Get my latest instrument analysis, market observations and educational notes by email when I publish them.
Free to join · Educational content only · Unsubscribe anytime
Your email will only be used for Instrument Analysis updates.
Instrument Analysis is provided for educational and informational purposes only. It is not personal financial advice, a trading signal, or a recommendation to buy, sell or hold any financial product.